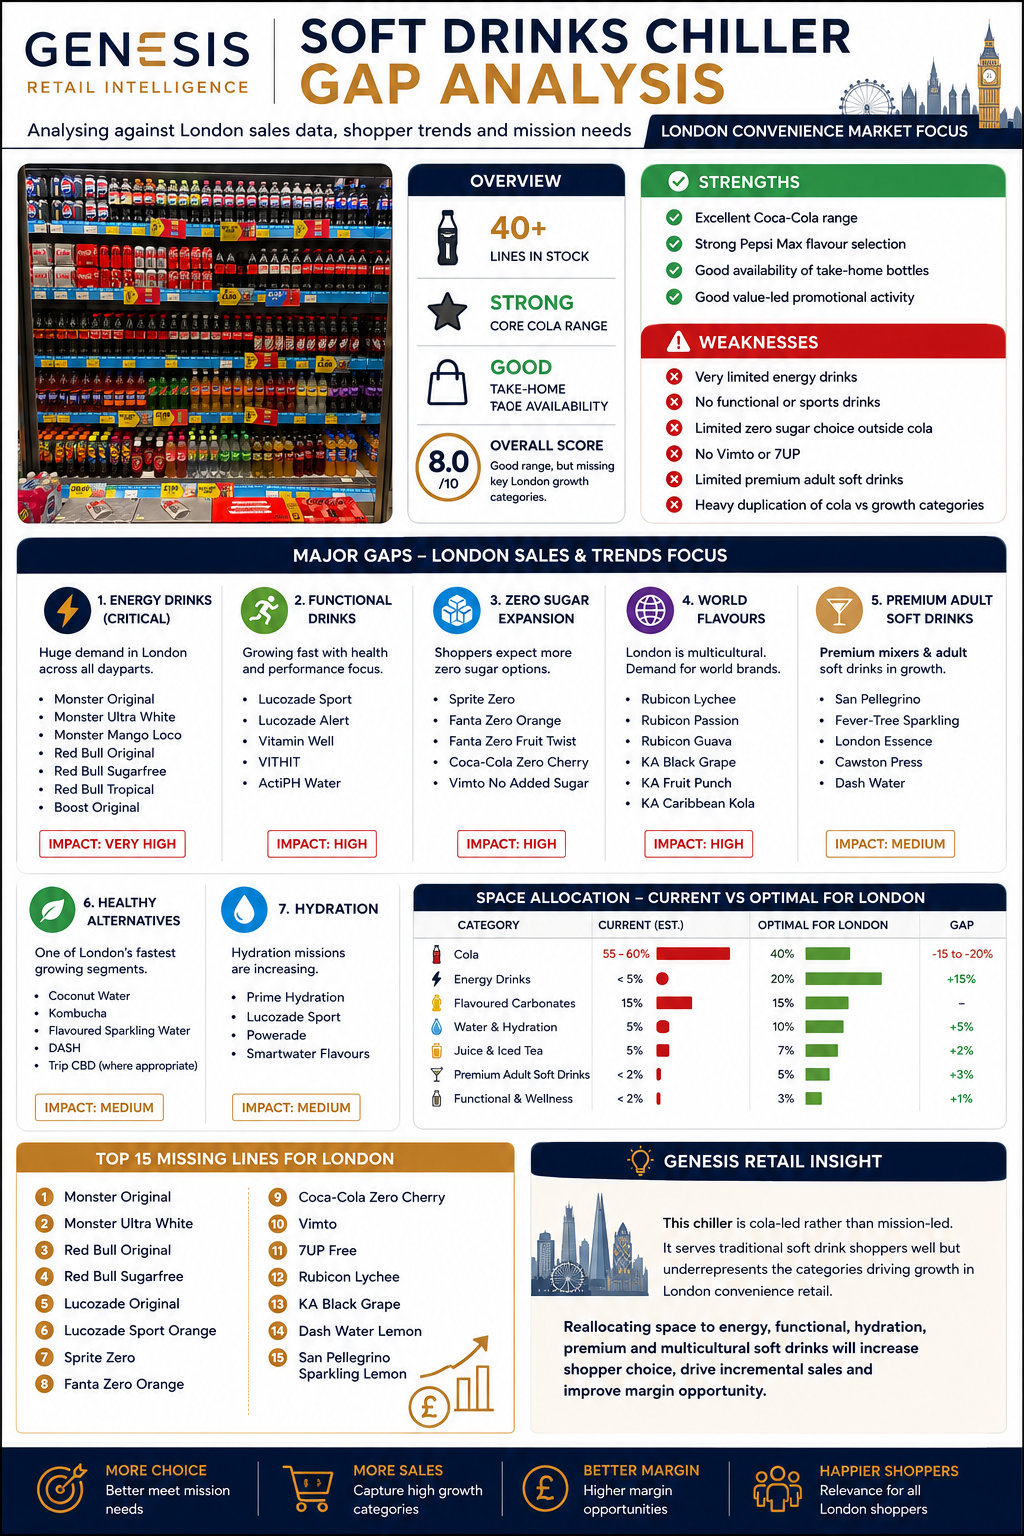
Send a photo of your key categories and I’ll give you a regional gap analysis: what’s missing, what’s over ranged, and where you’re losing sales to gaps.
What’s included
An independent view of your range — not a manufacturer’s planogram.
Manufacturer planograms are built to sell that manufacturer’s range, not to maximise your shelf. Genesis Retail reviews your key categories against the regional benchmark and gives you an unbiased view of what’s missing, what’s over ranged, and what the reset should look like.
Review a sample regional gap analysis to see the structure and the reset recommendation format before sending a photo of your own categories.